

With every tap of their Oyster Card or mobile phone, London commuters are providing the data that powers the city’s public transport network
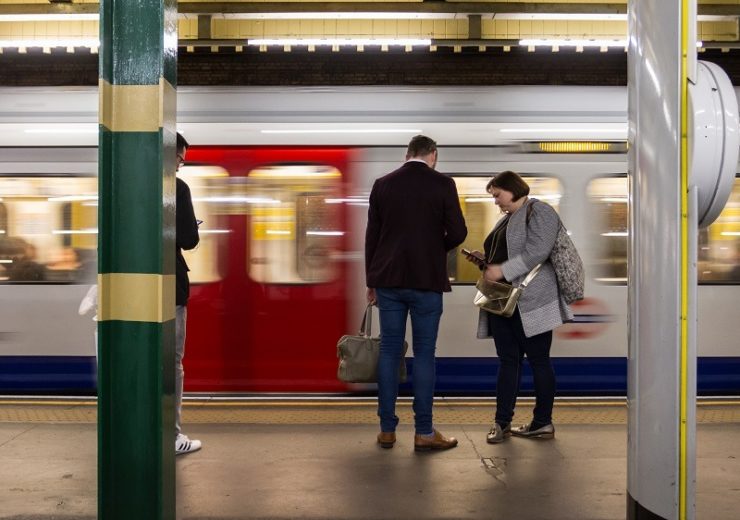
Passengers wait on a London Underground platform (Credit: Pexels)
Every day, 19 million people step on to the London Underground network using an Oyster Card, contactless card or mobile phone as a ticket – with each transaction collected in a big data set that can then be used to improve the transport system.
From easing overcrowding to alerting passengers about closures and delays that will affect them, Transport for London (TfL) analyses key information with the aim of making journeys more efficient.
Chief data officer Lauren Sager Weinstein describes the organisation’s purpose is “to deliver for the Mayor, keep London working and growing, and make life better”.
The local government body is synonymous with “mind the gap” platform warnings and the multi-coloured interlocking lines on the tube map, but its remit covers much more than the underground trains.
London’s busy bus network, road systems, traffic signals and cycling infrastructure are all controlled by TfL too.
The TfL mantra is “every journey matters” and, to that end, Ms Weinstein and her team are using data to gather information on the 26.8 million trips made on average in London every day.
Speaking at the Gartner Data Analytics Summit in London this week, she outlined how big data in transport is a growing trend.
Turning raw data into something useful
TFL receives massive amounts of data on each of its services every day.
There are 134 million “bus telemetry events” on a typical day assessing the location of each bus and 15,000 SCOOT detectors, which co-ordinate traffic signals – creating 5.2 billion records.

Ms Weinstein said: “We receive 500,000 rows of train diagnostic data on the central line alone.
“The data geek in me loves this but just the data isn’t enough – you can’t justify its existence unless it’s doing something useful.
“How do you take this raw data and construct it in such a way that it’s useful, digestible so that we can take action on it?”
Uses of big data in TfL transport network
Personalising emails
Sending emails updating customers on every network change and service to customers would be ineffective as they would quickly stop reading and unsubscribe.
Instead, Ms Weinstein explained that TfL uses data to tailor emails to individuals, giving them useful information on the transport routes they use, such as weekend closures or the opening of a new bus route.
She claimed this gives more value to its customers.
TfL also takes footfall and journey data to build a profile of how busy certain routes are, and share these out via email and on public notices.
Ms Weinstein added: “It is particularly useful for customers who may not use the route regularly and makes people aware what is happening on the network.
“We are investing to improve the network and capacity but that takes time so we have to make sure people are aware that at certain times and places, things will be busy.
“We are very transparent about that and data powers these conversations with our customers.”
Tracking bus routes
Monitoring the routes of passengers on the underground network is a simple process of seeing where they “tap in” to enter the subway and which station they “tap out” at.
However, on London’s iconic red buses, there is no need to tap a card on the contactless system as you exit.
This creates a problem for TfL.
Ms Weinstein said: “We have an entry point and a time stamp but because we don’t have an exit point we didn’t know the full journey.”
TfL worked with Michigan Technological University and research partners to come up with an algorithm that makes an inference on the likely point at which someone gets off the bus.

This is done by seeing where the card is next used to enter the London transport system.
“You can then see if they went from bus to tube and, from that, make an inference on the time and stop they got off the bus at,” said Ms Weinstein.
“This helps to build up a complete picture of travel on our network by filling in the gaps.
“We use that to calculate capacity planning and understand where our customers are going.”
Using Wi-Fi hotspots as a new data source
In 2016, TfL trialled a new data input method that picked up the probing requests from devices trying to make a connection to the Wi-Fi network at underground stations.
The data was used to estimate the number of people on a train or at a station at any given moment – information that could then be used to ease overcrowding.
Over the four-week trial, half a billion pieces of data were anonymised and collected by TfL from 5.6 million devices.
Ms Weinstein said: “We were able to look at busy stations and trains and estimate the number of people in a crowd.
“For example, we could see that over a five-minute period on the Victoria line, between 8.20am and 8.25am, it’s very, very busy.
“With this information, you can begin saying to customers, ‘if you shift your time by ten minutes’, the route would be a little less busy.
“This is hugely helpful for them and for us.”

The data could also be used to work out movements within a station and calculate the time it takes to move around complex stations, such as Euston.
She added: “When Kings Cross has a problem, people move to Euston and then that gets congested.
“We can see how the crowding builds up and measure the difference in walk time between the two.
“At the most congested points, we have to shut down the station in order for the congestion to clear.
“Historically, we didn’t have the data to measure this, but now we have a way to measure the impact of what’s happening.
“We can then test different methods of station control to see how it works and make an evidence-based decision.”